Visualizing the
Occupation &
Its Human Cost
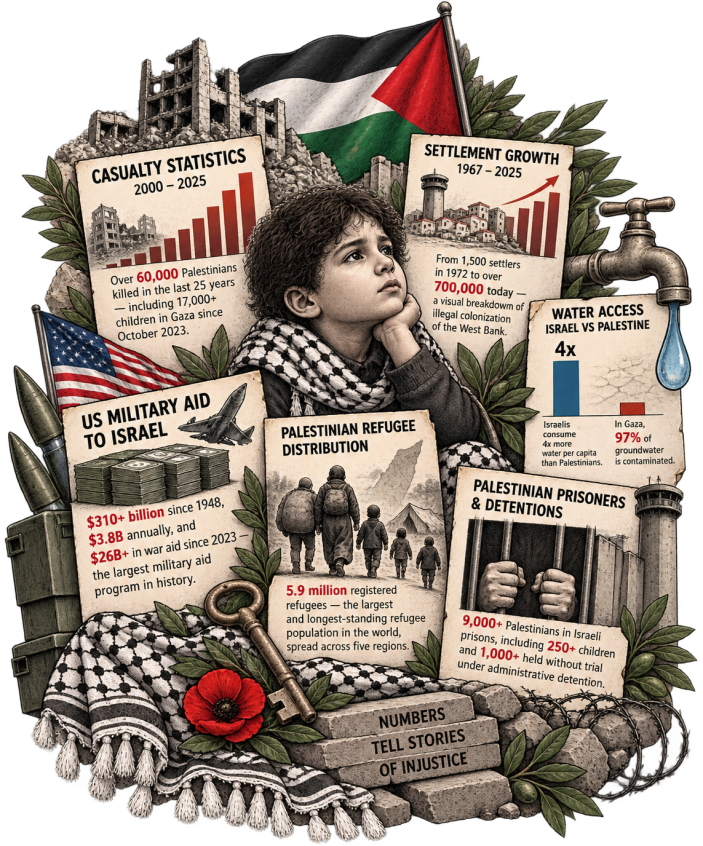
Interactive data visualizations that bring the numbers to life — casualty statistics, settlement growth, water access, military aid, refugees, and prisoners. Every chart tells a story of injustice.
Casualty Statistics (2000 – 2025)
Over 60,000 Palestinians killed in the last 25 years — including 17,000+ children in Gaza alone since October 2023.
View DataSettlement Growth (1967 – 2025)
From 1,500 settlers in 1972 to over 700,000 today — a visual breakdown of the illegal colonization of the West Bank.
View ChartWater Access: Israel vs Palestine
Israelis consume 4x more water per capita than Palestinians. In Gaza, 97% of groundwater is contaminated.
CompareUS Military Aid to Israel
$310+ billion since 1948, $3.8B annually, and $26B+ in war aid since 2023 — the largest military aid program in history.
View BreakdownPalestinian Refugee Distribution
5.9 million registered refugees — the largest and longest-standing refugee population in the world, spread across five regions.
View DistributionPalestinian Prisoners & Detentions
9,000+ Palestinians in Israeli prisons, including 250+ children and 1,000+ held without trial under administrative detention.
View Statistics